
Trending Apps
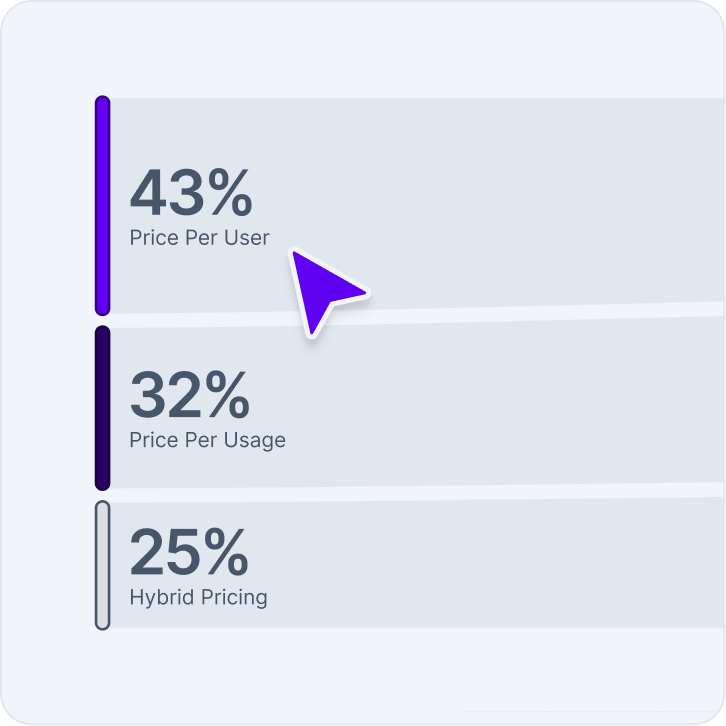
Most popular SaaS vendors by spend
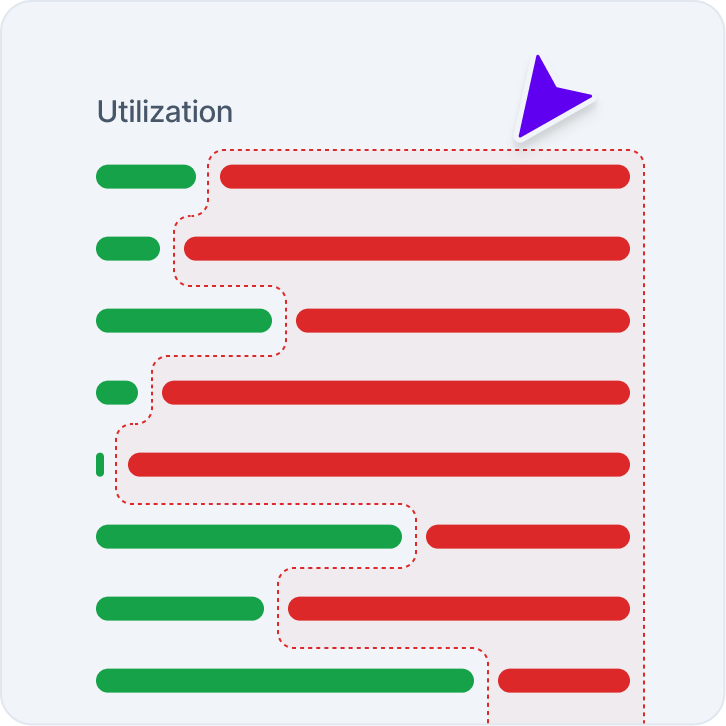
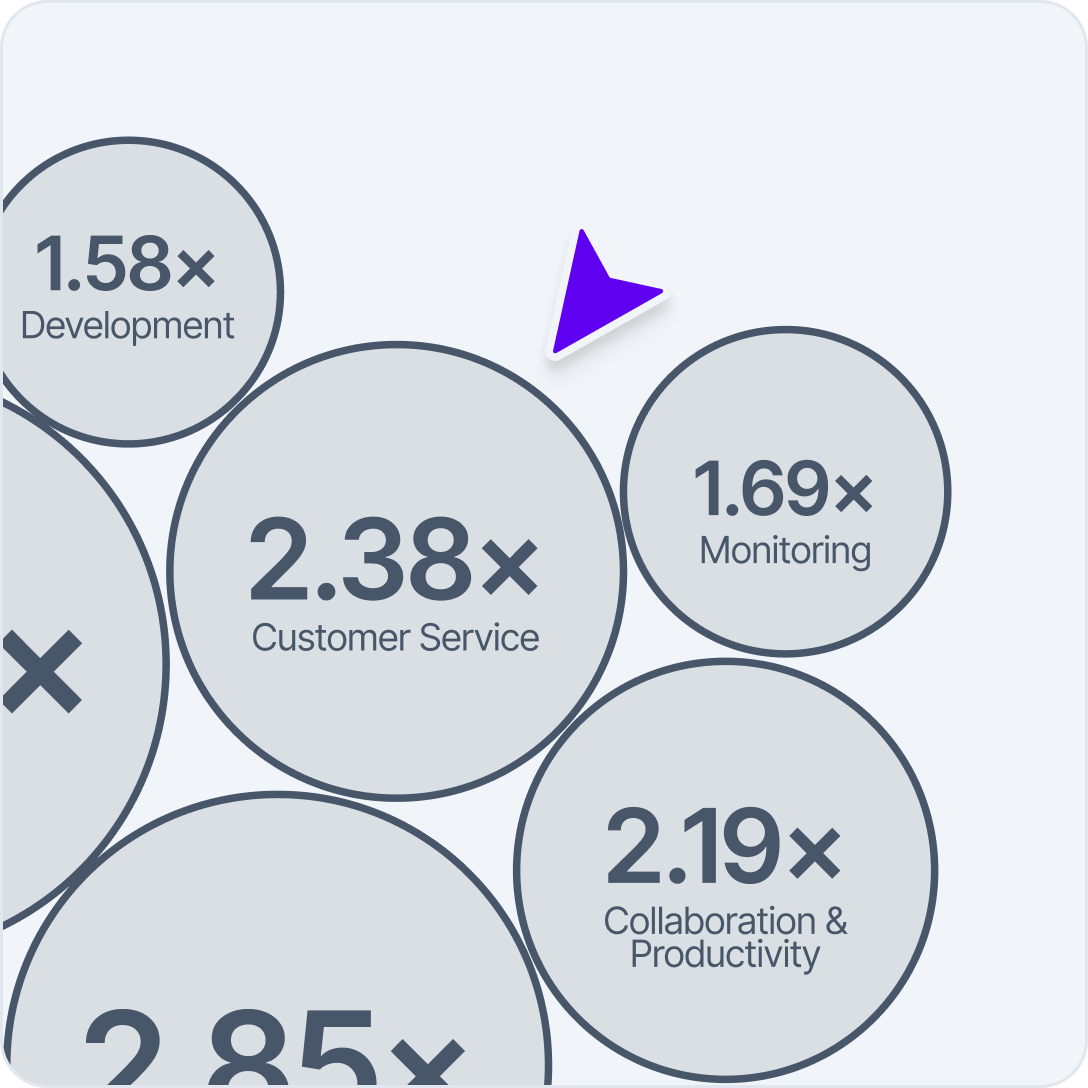
Most utilized SaaS tools
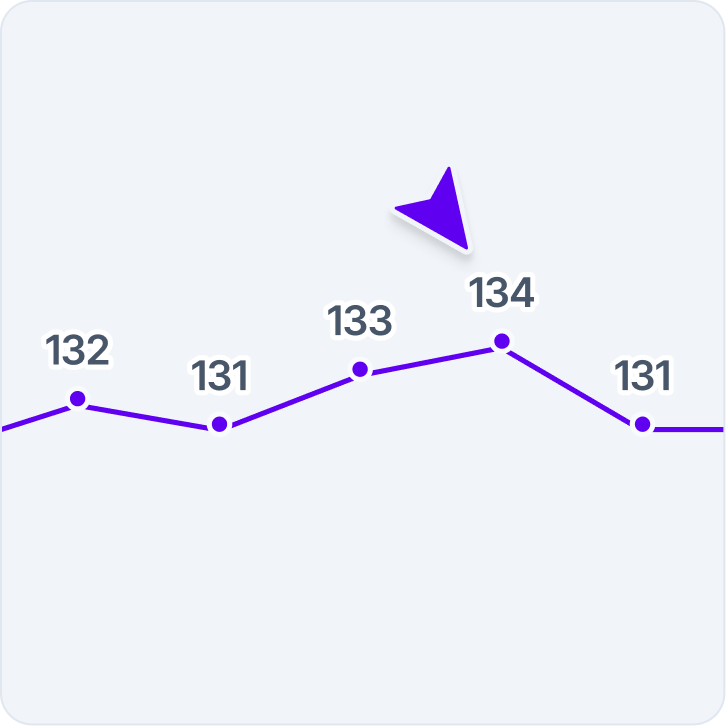
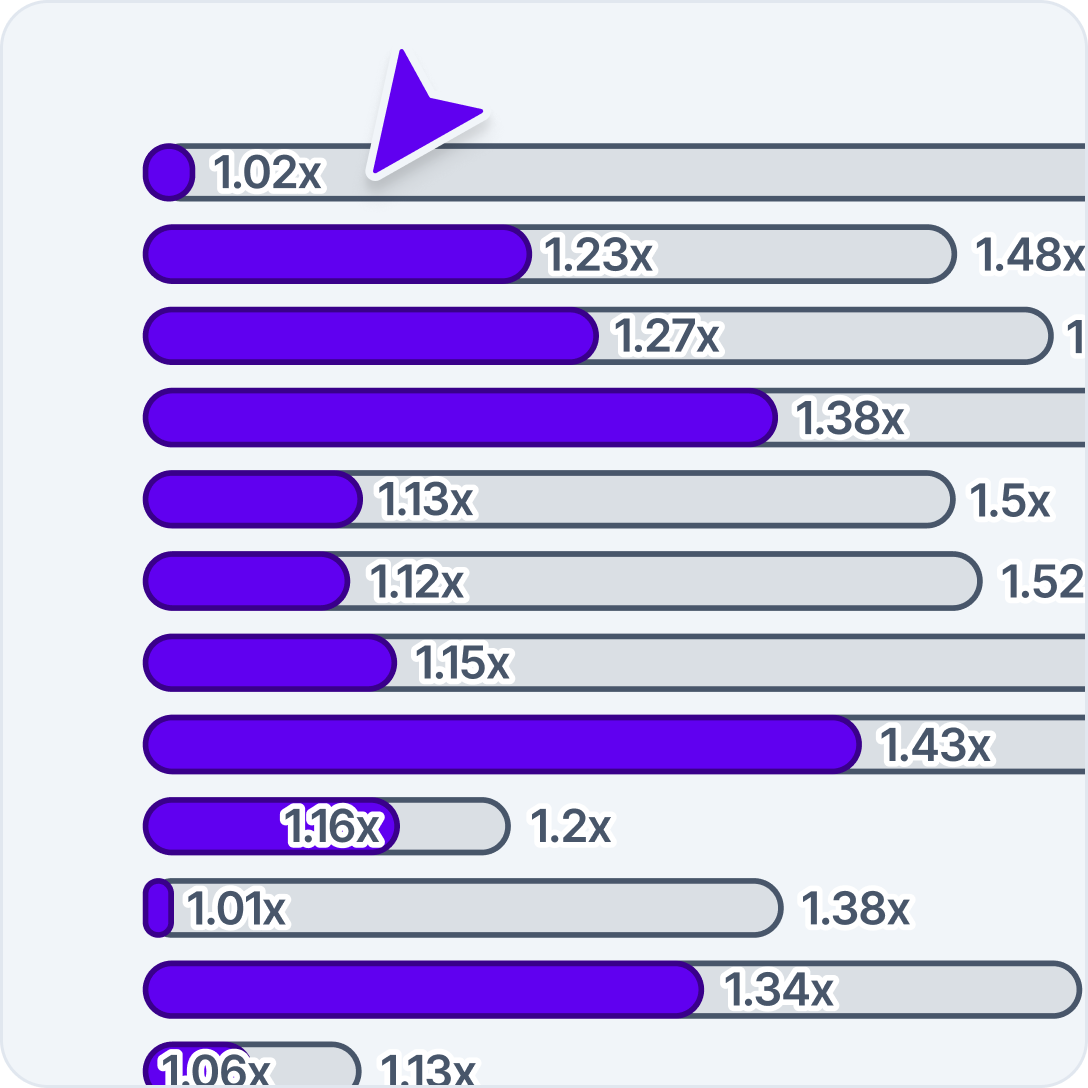
Fastest-growing SaaS vendors
Most popular AI software
SaaS Insights


Procurement Insights


Frequently asked questions
For procurement professionals, useful procurement insights are grounded in what’s really happening across the supply chain. That means having clear data on spend, suppliers and changing demand, so teams can spot issues early.
Good procurement insights help teams reduce costs by making inefficiencies easier to identify and trade-offs easier to assess. When insights feed directly into procurement strategy, teams can decide where to invest, understand the real difference between short-term savings and long-term value, and simplify complex decisions across finance and procurement.
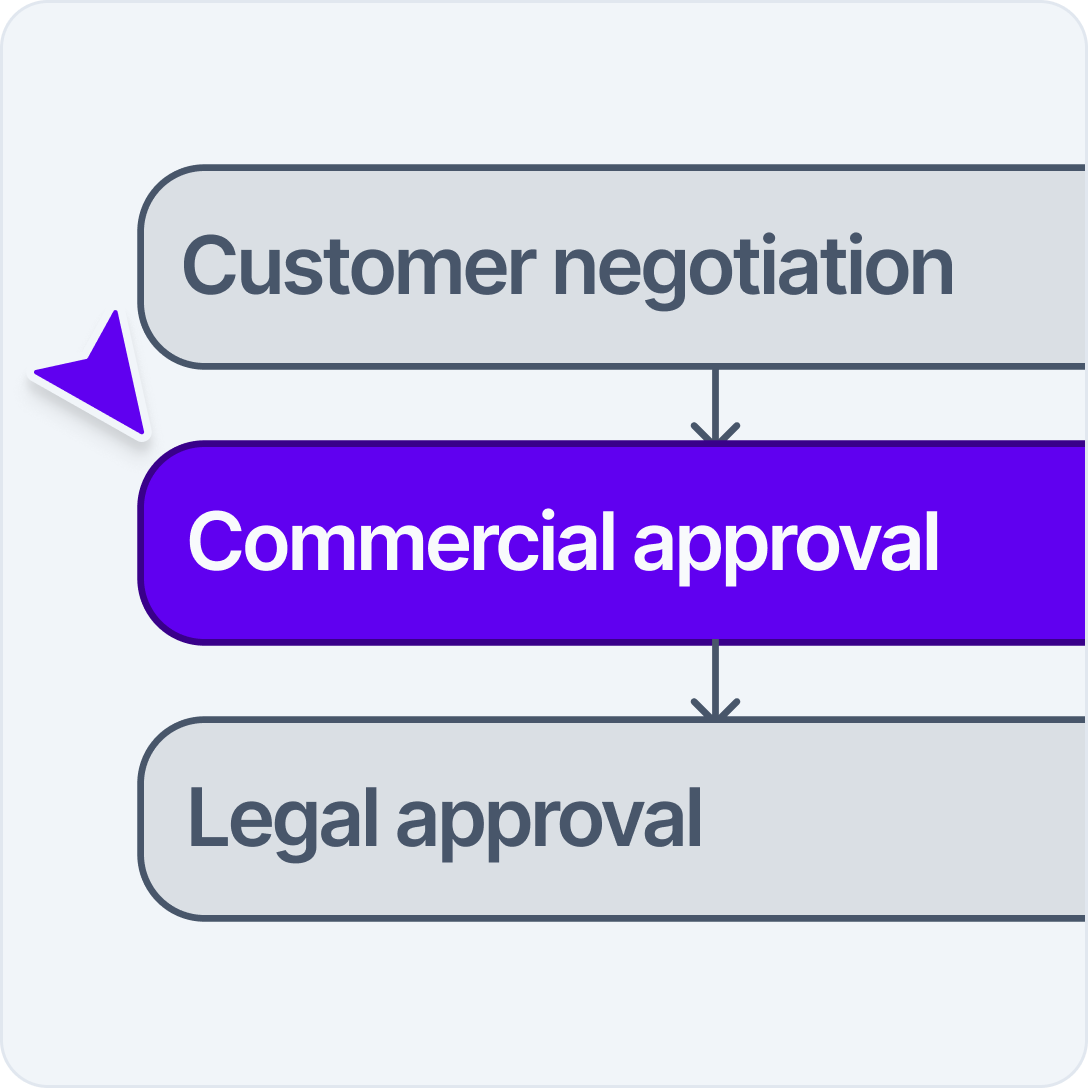
Vertice’s approach to procurement insights focuses on giving teams access to information they can act on, not just static reports. By combining software with expert services, Vertice works in close partnership with customers to help them gain clarity, align stakeholders and move from insight to execution faster.
This is driven by an expansive global dataset drawn from over $10bn of processed spend, allowing Vertice to provide high-quality, real-world insights that give you total transparency into market pricing and unmatched leverage during negotiations.
Clear procurement insights support leadership teams by giving them a better view of spend, suppliers and long-term commitments. This visibility makes it easier to weigh commercial priorities alongside sustainability goals, manage risk and make informed decisions that support responsible growth over time.
Join the community
.webp)