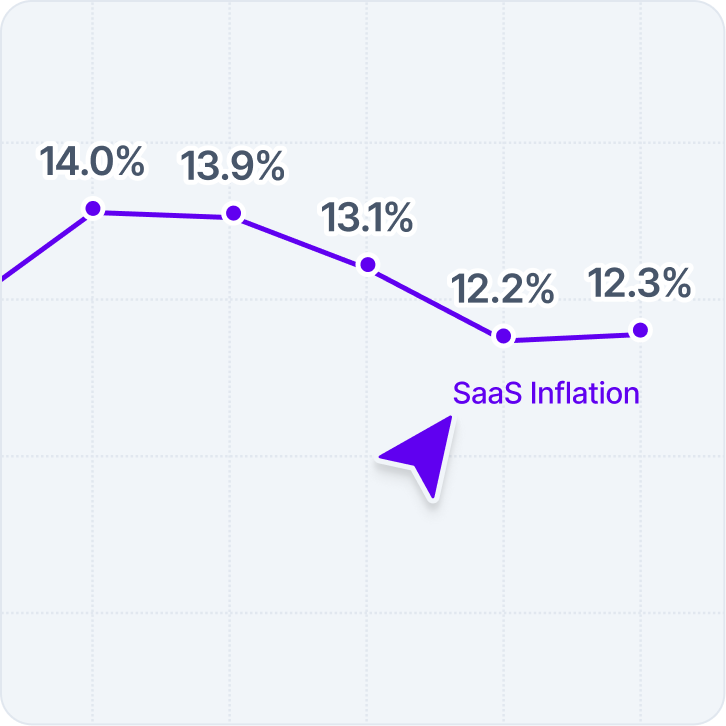
SaaS benchmark prices deviation

Which SaaS categories have the highest pricing inconsistency in 2026?
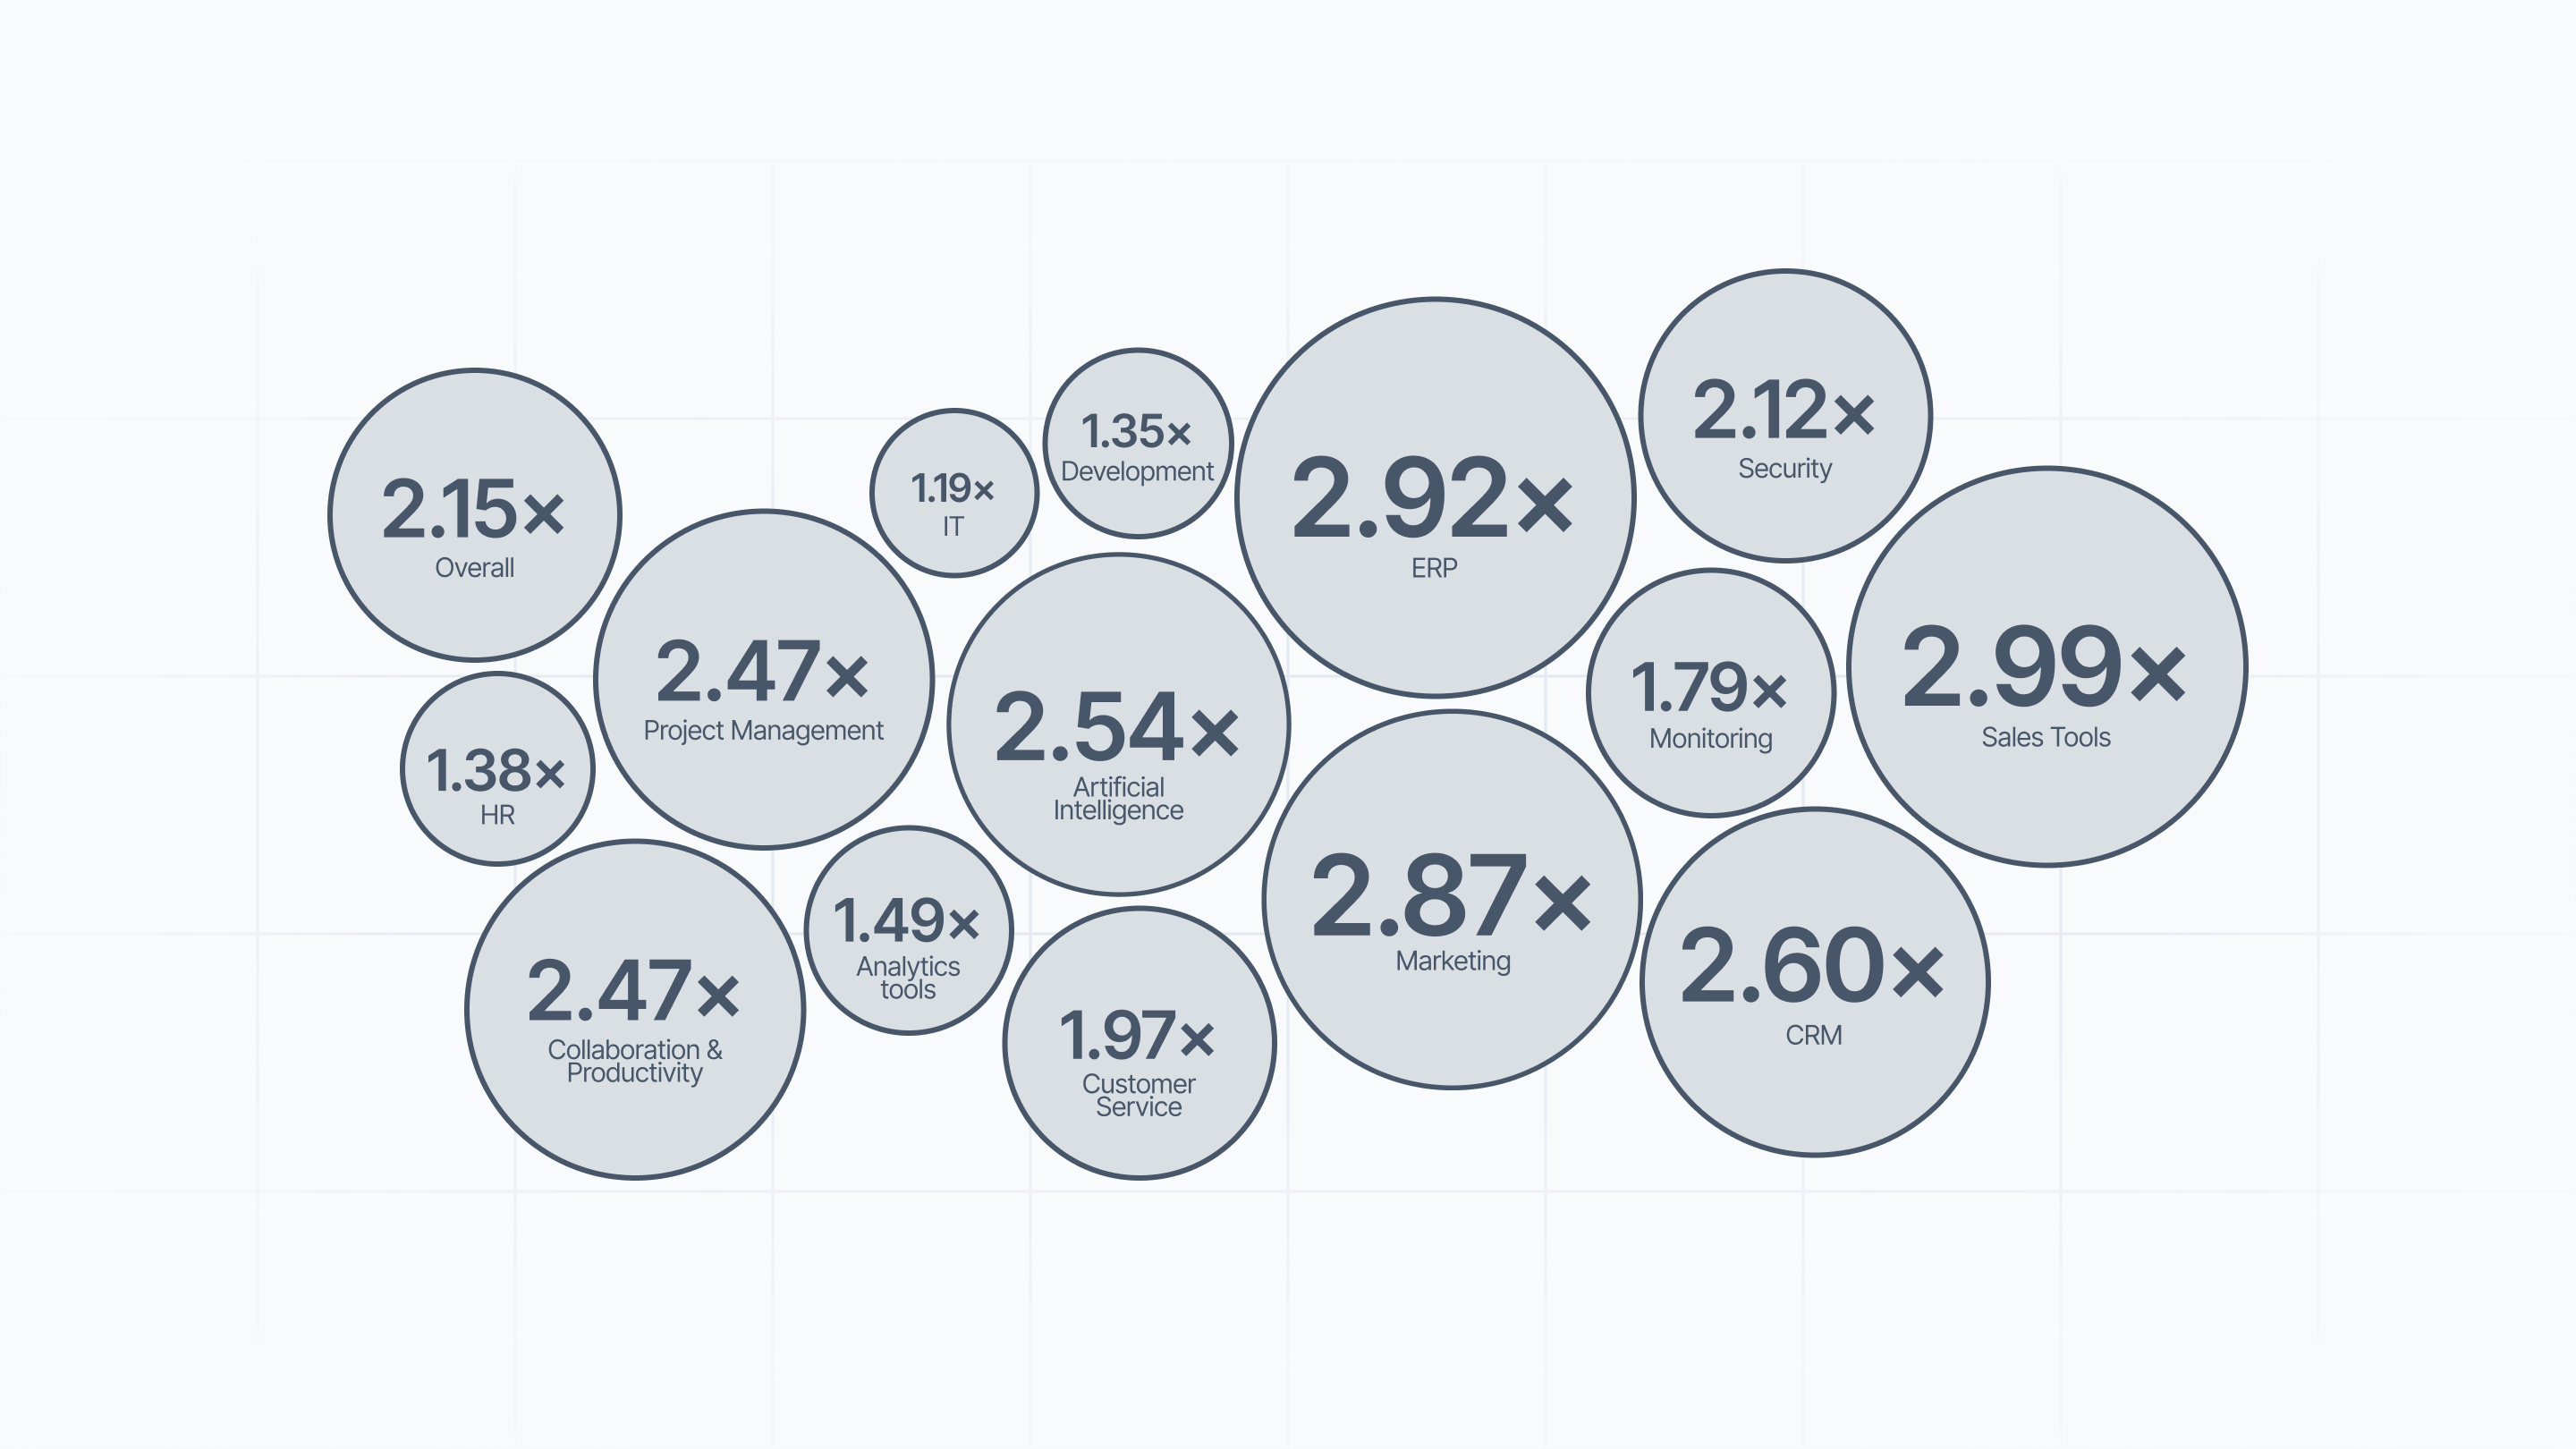
In 2026, SaaS pricing consistency varies significantly depending on the maturity of the category. Vertice’s latest analysis of $30bn in global spend reveals a wide "Pricing Benchmark Deviation” – the gap between the most competitive contracts (the 20th percentile) and the higher-end market rates (the 80th percentile).
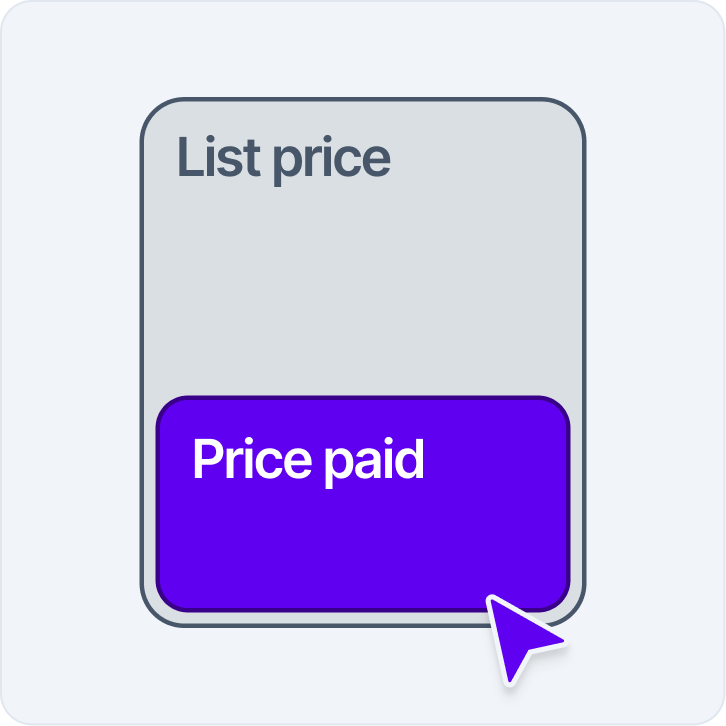
The average price gap across all SaaS categories is 2.15x. This disparity is rarely a reflection of procurement skill and is instead a byproduct of a market where complex bundling, tiered feature-gating and opaque discounting remain the status quo.
SaaS pricing deviation benchmarks by category (2026)
The 20th vs. 80th Percentile Ratio measures how much prices vary within a category. A higher ratio indicates a market where prices are highly variable and customized, making third-party benchmarks essential for reaching a fair market rate.
These categories can largely be categorized into three maturity tiers:
Tier 1: Mature and stable (more consistent pricing)
Categories: IT Infrastructure (1.19 ratio), Development (1.35), HR (1.38), Analytics (1.49).
While these markets have settled into "utility" pricing with more transparent lists, don't mistake consistency for a lack of savings opportunity. Even in a low-variance category like IT Infrastructure, an uninformed buyer can still pay 19% more than the market leaders. Securing the 20th percentile rate here isn't automatic; it relies on real-time benchmarks and negotiation expertise to capture the "last mile" of available discount that vendors reserve for data-backed buyers.
Tier 2: Evolving and standardized (moderate variance in pricing)
Categories: Monitoring (1.79 ratio), Customer Service (1.97), Security (2.12).
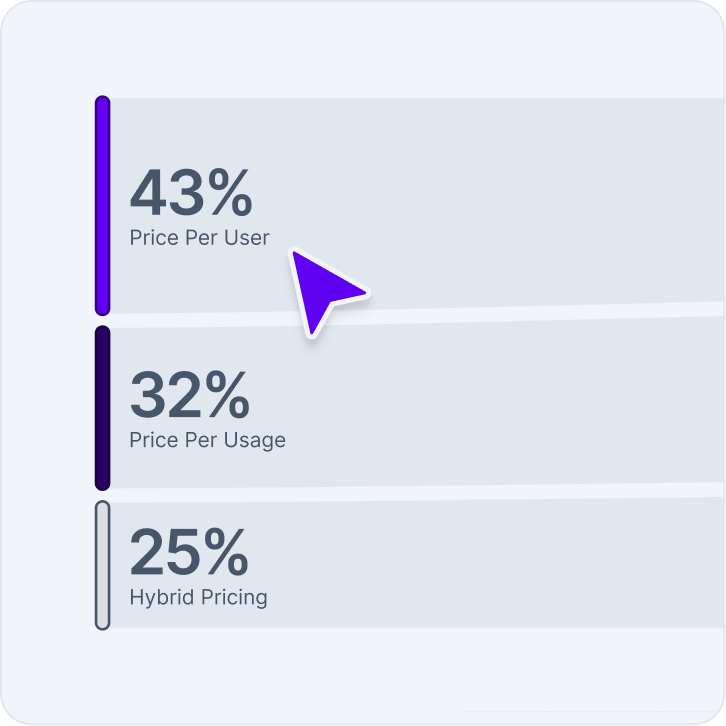
These categories are mature but maintain moderate pricing divergence through frequent feature innovation (e.g predictive analytics add-ons) and tiered usage models. While the core product is stable, vendors use "premium" layers to create differentiation, making it easier for costs to creep upward without a firm benchmark.
Tier 3: High-complexity and emerging (highest disparity in pricing)
Categories: Sales Tools (2.99 ratio), ERP (2.92), Marketing (2.87), AI (2.54).
This tier represents the highest pricing deviation. Legacy complexity (ERP/Sales) allows vendors to mask unit costs within bespoke enterprise bundles, while emerging volatility (AI) stems from a "land-grab" phase where vendors are still trying to achieve market share. Here, the difference between the 80th and 20th percentile can mean the difference between a fair deal and paying triple the market rate.
Data source: These insights are derived from over $30bn of global processed spend managed by Vertice in 2026.
See how much you could be saving on SaaS in 2026.
See how simple procurement can be
Related insights
Join the community
.webp)
The need-to-knows about Vertice
Pricing deviation exists because vendors have a bird's-eye view of the market, while individual companies often only see their own contracts. Vertice levels the playing field by acting as a strategic data and negotiation partner.
- Real-time, independent benchmarking data: Vertice leverages transactional data from 16,000 global suppliers, allowing procurement teams to see exactly where their current pricing sits on the 2.15x deviation scale.
- Expert negotiation: Vertice’s specialists leverage these benchmarks to help organizations move from high-end market rates toward the 20th percentile, typically securing 20%+ guaranteed savings across an organization’s entire software stack.