
Company tech stack size
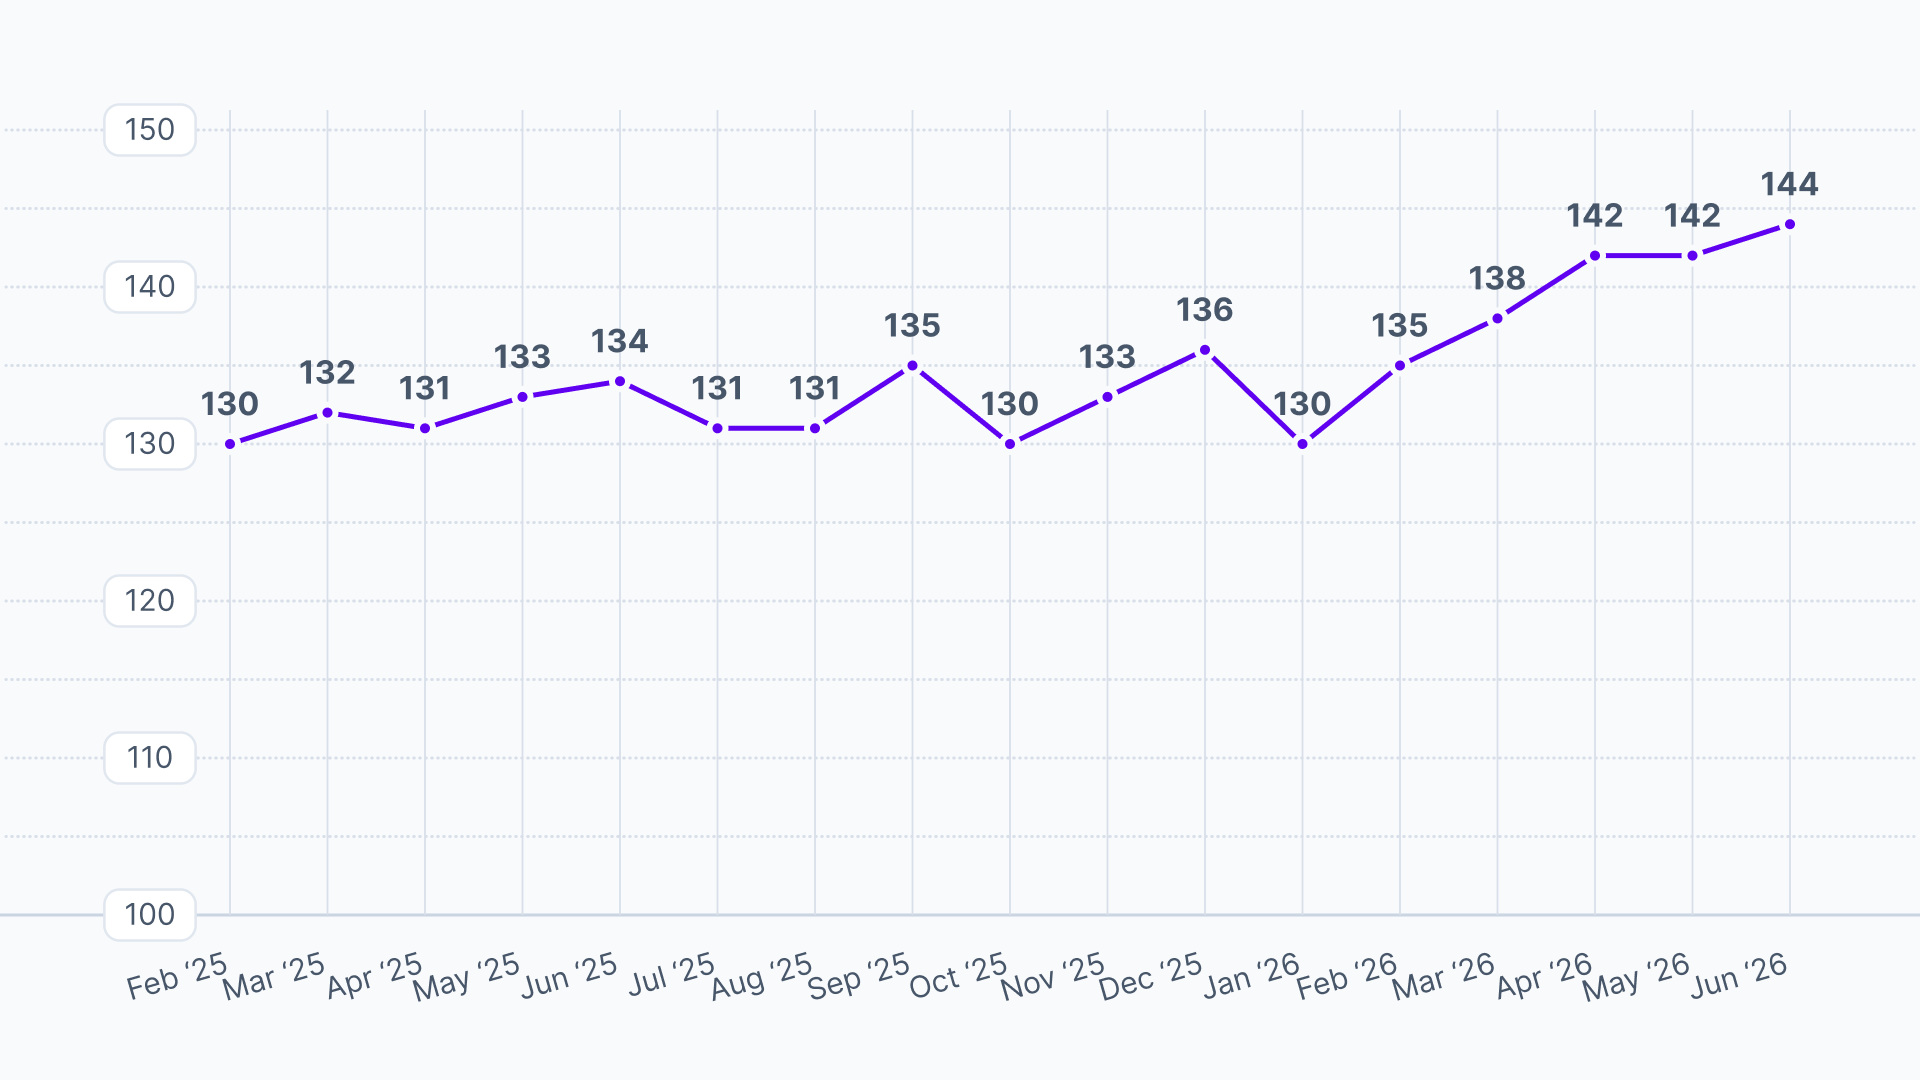

SaaS stack analysis: Growth and volatility
The average business now manages 144 individual SaaS applications, up from 138 in March 2026 and 131 in June 2025 – an increase of 4.3% and 10%, respectively. Despite a market-wide focus on consolidation, organizations continue to adopt new software faster than they retire old tools and Q2 2026 marks a new record high for tech stack size.
- Q2 growth: The average SaaS stack grew by 4.3% in a single quarter, adding six tools between Q1 and Q2 2026 – a faster pace of growth than any other quarter tracked so far.
- Net growth since 2025: The average software portfolio has expanded 10% since June 2026.
- Audit cycles: Sharp dips – such as the drop from 136 in December 2025 to 130 in January 2026 – suggests aggressive start-of-year audit cycles. However, these “cleanups” are historically temporary, with the stack consistently rebounding to new record highs within a couple of months.
Why are companies growing their tech stacks?
Despite "consolidation" remaining a corporate priority, several factors continue to drive stack growth:
- Specialized AI tools: Organizations are adding dozens of niche AI "point solutions" for specific tasks like code generation and automated prospecting, even while attempting to consolidate core platforms.
- Shadow IT: Low-cost, "click-to-buy" subscriptions are frequently purchased at the departmental level on corporate cards, bypassing centralized IT and procurement oversight.
- The integration gap: As core platforms (like ERPs or CRMs) fail to meet specialized departmental needs, teams add "sidecar" applications to fill functional gaps.
Left unmanaged, this growth compounds the SaaS waste problem: more tools generally means more overlap and more shelfware. Usage analytics can flag underused or duplicate applications before they add to next quarter's count, and vendor management tools help centralize oversight so departmental purchases don't keep bypassing procurement unnoticed.
Data source: These insights are derived from over $75bn of global processed spend managed by Vertice in 2026.
Are you overpaying for SaaS?
Are you overpaying for SaaS?
Related materials


Join the community
.webp)
The need-to-knows about Vertice
As of Q2 2026, the average business manages 144 individual SaaS applications, up from 138 in Q1 2026 and 131 in June 2025.
Usage analytics can identify underused or duplicate tools before they add to unnecessary sprawl, while vendor management software helps centralize purchasing oversight so shadow IT purchases don't go unnoticed.