
Vendor stickiness by SaaS category
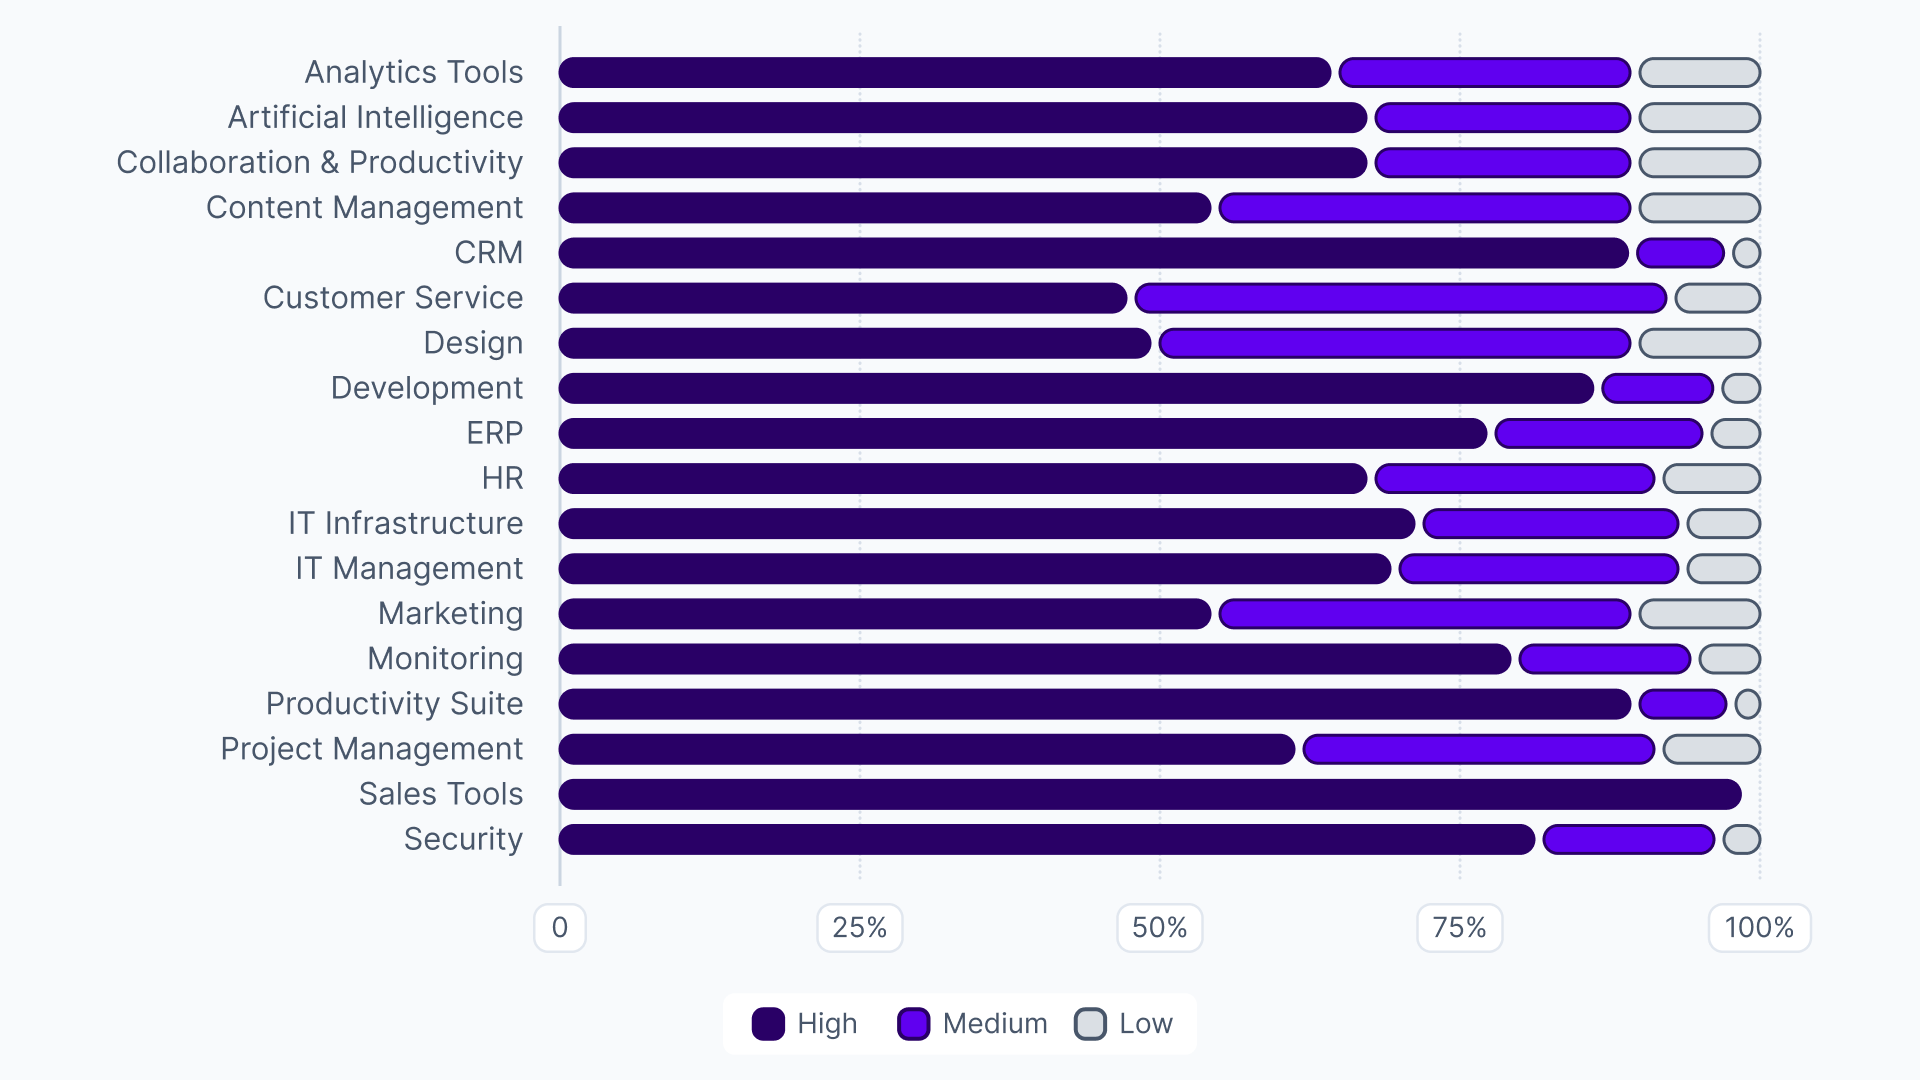

What percentage of software spend is tied to deeply embedded vendors? 2026 benchmarks
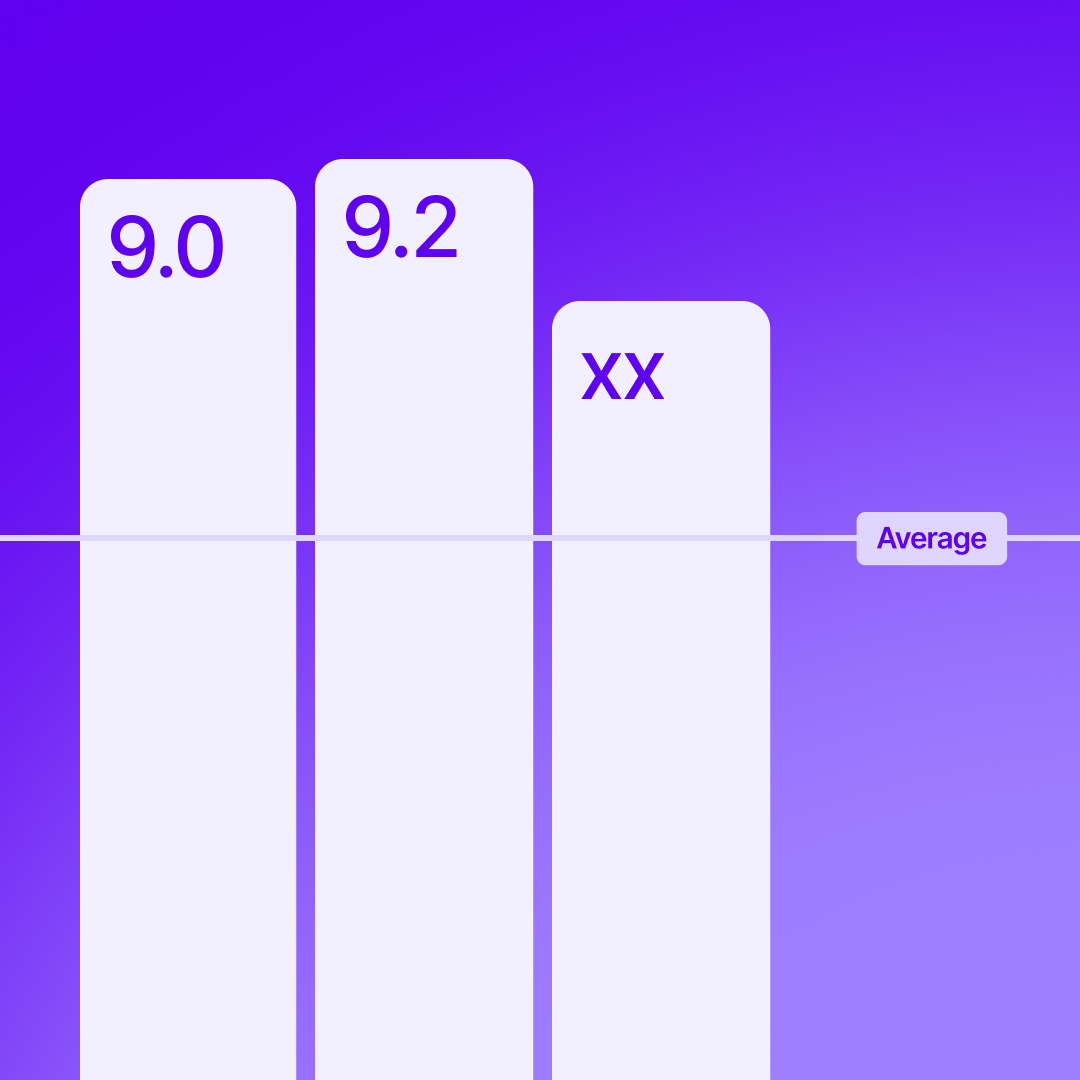
74.8% of the average company's SaaS spend goes to mission-critical vendors – platforms so deeply integrated into daily operations that the effort required to switch providers often outweighs any potential savings. This concentration has increased in 15 of the 18 software categories tracked over the past three months, meaning vendor lock-in isn't just widespread, it's deepening.
CRM (89.8%), Sales (99.2%) and Development (86.9%) remain the most deeply integrated tools in the average business, often spanning multiple departments and core processes – a reminder of how much of this lock-in risk is now concentrated in just a handful of categories.
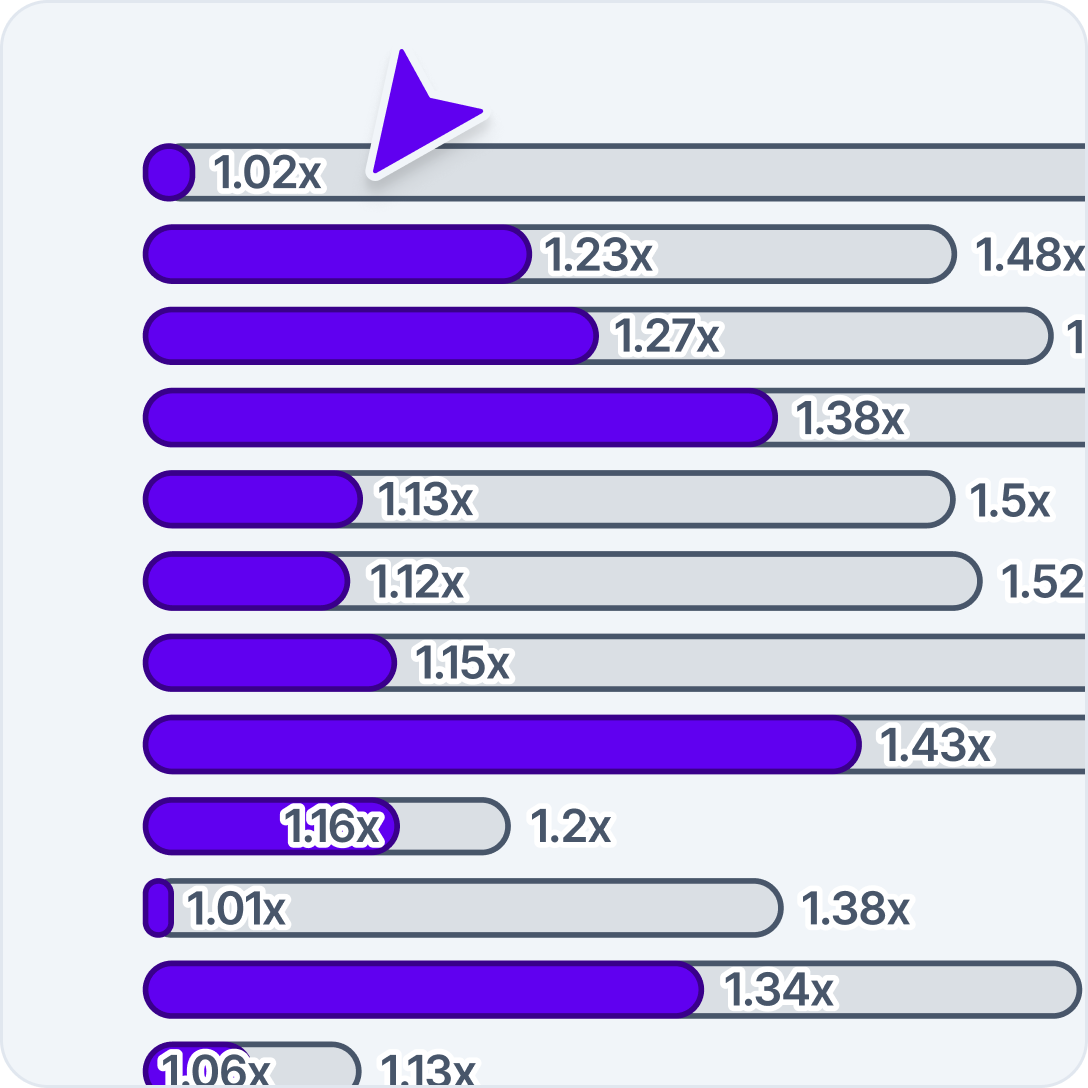
- Artificial Intelligence is becoming stickier faster than any other category: AI's high-stickiness share rose 3.0 percentage points over the past three months, the largest increase tracked, suggesting AI tools are becoming embedded into workflows faster than many buyers may realize.
- Design and Customer Service are the only categories trending the other way: Both saw a 1-point decline in high-stickiness share, reinforcing that these categories remain comparatively easier to switch away from than the rest of the market.
- Already-sticky categories are becoming stickier still: Sales Tools, already at 98.5% three months ago, has climbed even closer to full saturation at 99.2%, alongside further gains in Productivity Suite, CRM and Development, suggesting lock-in isn't just persistent in these categories, it's deepening.
These figures reinforce the importance of securing optimal terms and contract flexibility from the outset, and of taking a proactive approach to supplier management – particularly for critical platforms where switching costs, integration complexity and business impact are significant.
By understanding which tools are highly sticky versus those that are more flexible, procurement teams can prioritize negotiation, contingency planning and strategic management where it matters most, while maintaining agility for less-critical tools. For more tactical recommendations for mitigating this risk, download our report on avoiding vendor lock-in.
Data source: These insights are derived from over $75bn of global processed spend managed by Vertice in 2026.
Are you overpaying for SaaS?
Are you overpaying for SaaS?

Related insights

Join the community
.webp)
The need-to-knows about Vertice
Almost three quarters of the average organization’s SaaS spend is concentrated in vendors that are considered highly embedded and difficult to replace. Sales tools have the highest vendor stickiness, followed by productivity suites (90%) and CRM platforms (89.8%).
Customer Service and Design have the lowest rates of vendor stickiness at 48% and 50% respectively, and both saw a slight decline between Q1 and Q2 2026.